JMATHPLOT project has ended and is forked in JMATHTOOLS toolbox

Goals

JMATHPLOT is designed to provide easy-to-use plot methods in JAVA.

JMATHPLOT source code is designed to be easily modified by everyone.

Description

JMATHPLOT is a JAVA package for datas visualization.
JMATHPLOT provides frequently used plot types (scatterplot, histogram, boxplot,...) for medium sized datas (too large amount of datas may be very slow to display...).
JMATHPLOT needs the Java Virtual Machine 1.4.

Example of use

If your bandwidth is good, see this simple example applet.

Command line used : java -classpath "jmathplot.jar:." Simple3DScatterPlot
(jmathplot.jar and Simple3DScatterPlot.class are placed in the current directory)

java source code of Simple3DScatterPlot class :
   1:import org.jmathplot.gui.*;
2:
3:/**
4: * <p>Copyright : BSD License</p>
5: * @author Yann RICHET
6: * @version 1.0
7: */
8:
9:public class Simple3DScatterPlot {
10: public static void main(String[] args) {
11:
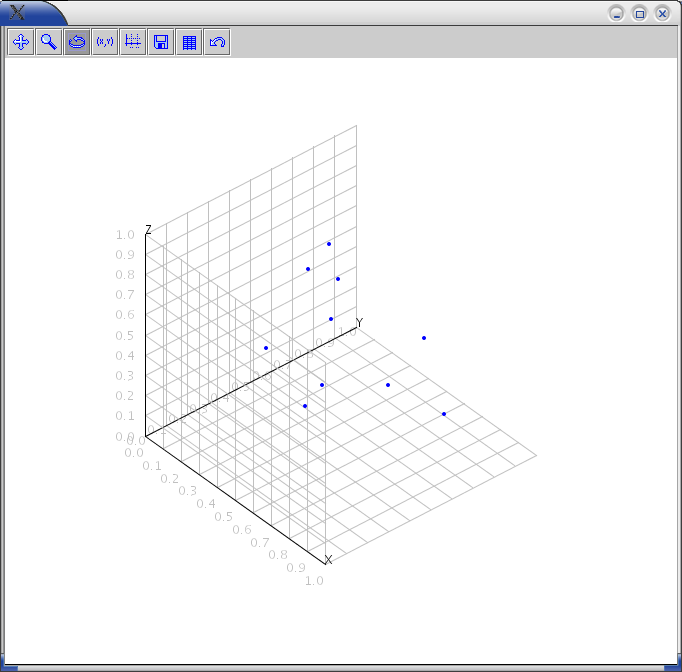
12: // Build a random 3D data set
13: double[][] datas = new double[10][3];
14:
15: for (int i = 0; i < datas.length; i++) {
16: for (int j = 0; j < datas[0].length; j++) {
17: datas[i][j] = Math.random();
18: }
19: }
20:
21: // Build the 3D scatterplot of the datas in a Panel
22: Plot3DPanel plot3d = new Plot3DPanel(datas,"datas","SCATTER");
23:
24: // Display a Frame containing the plot panel
25: new FrameView(plot3d);
26:
27: }
28:}

The JAVA frame obtained :


SourceForge Logo